Gujarat Cancer Society Research Journal |
|
 |
| |
|
Original Articles
Significance of GSTP1 Protein Expression in Invasive Ductal Carcinoma of Breast
(a)Mandalia Toral(1),(b)Gajjar Kinjal(1), Ghosh Nandita(2)
Research Assistant(1), Associate Professor(2)
Tumor Biology Lab, Cancer Biology Department
The Gujarat Cancer & Research Institute, Asarwa, Ahmedabad, Gujarat, India
Corresponding Author: nandita.ghosh@gcriindia.org,
 (a) https://orcid.org/0000-0002-3495-1600 (a) https://orcid.org/0000-0002-3495-1600
(b)https://orcid.org/0000-0002-1126-0217
https://orcid.org/0000-0002-0210-7317 |
Volume : 23 / Number : 1 / April 2021
|
Summary
Glutathione S-transferases (GSTs) are important
isoenzymes that play an essential role in detoxification of
carcinogens and acts as endogenous inhibitor of MAP kinase
pathway. GST Pi 1 (GSTP1) isoform has been documented to
contribute to drug resistance in breast cancer patients. Hence,
present study aimed to investigate the prevalence of GSTP1
p r o t e i n e x p r e s s i o n i n b r e a s t c a n c e r p a t i e n t s b y
immunohistochemistry method and further to examine its
correlation with various clinicopathological parameters. Total 70
untreated patients with invasive ductal carcinoma of breast cancer
(70 tumor tissues and 30 adjacent normal tissues) were included in
the study. Statistical analysis was carried out using SPSS software.
The results indicated that- cytoplasmic and/or nuclear GSTP1
immunoreactivity was observed in 76% tumors and 97% adjacent
normal tissues of the breast cancer patients. Significant higher
GSTP1 protein expression was observed in high BR score tumors
(78%; P=0.007), ER-ve patients (68%; P=0.008), TNBC patients
(78%; P=0.004) and patients having absence of perinodal
extension (56%; P=0.050) as compared to their respective counter
parts. Hence, there is loss of GSTP1 protective function during the
transition of malignant transformation. Higher GSTP1 expression
is associated with aggressive prognosticators of breast cancer.
However, confirmation in larger set of patients and longer follow
up details is needed to evaluate the potential of GSTP1 as a
prognostic marker.
Keywords: GSTP1, breast cancer, immunohistochemistry,
TNBC, Glutathione S-transferases |
Introduction
Epidemiological studies suggest that breast
cancer is the most common type of cancer among
women with continuous prevalence throughout the
world.1 Although its incidence is not the same in
different countries and ethnic groups, breast cancer
has become a significant public health challenge
among women worldwide.2,3 It is a multifactorial and
polygenic disease which may be influenced by both
environmental and genetic factors.4,5 Although there
are several comprehensive treatment options, such as
surgery, chemotherapy, and endocrine therapy, many
patients still have high rates of metastasis and
recurrence, which remain the primary cause of death
in patients with breast cancer.6 Patients with triple
negative breast cancer (TNBC) account for about
15–20% of total breast cancer cases, which have higher rates of metastasis and recurrence, and lower
survival rates compared to other subtypes because
these patients do not receive anti-receptor therapy.
Therefore, other potential prognostic markers and
new therapeutic targets for BC should be explored.7 In
recent years, some genes have been confirmed as
potential cancer susceptible genes. Glutathione Stransferases
(GSTs) are overwhelmingly important
genes, which play key role in the detoxification of
toxic, potentially carcinogenic compounds, and a host
of basic physiological processes of the human body.8–11
They are a super family of dimeric phase-II metabolic
enzymes that have an irreplaceable role in the cellular
defense system.12, 13 In human, classes of GST enzymes
include alpha-α, mu-μ, pi-π, sigma-σ, omega- Ω and
theta-θ.14 Louie S M. found that GST Pi 1 (GSTP1)
was a new breast cancer oncogene that governed the
pathogenicity of cancer by regulating glycolysis, and
energy and fat metabolism.15 Although some reports
had shown the association between GSTs and overall
survival in breast cancer patients, the results were not
consistent.16-19 Therefore, the aim of the present study
was to investigate the relationship between the
GSTP1protein expression and the clinicopathological
characteristics of breast cancer patients. |
Material and Method
Patients
Seventy untreated and histopathologically
confirmed invasive ductal breast carcinoma female
patients diagnosed at Gujarat Cancer & Research
Institute (GCRI) were included in this retrospective
study. The study was approved by Institutional
Scientific and Ethical Committees and informed
consent was obtained from all subjects prior to
treatment administration. Detailed clinical and
pathological history i.e. age, menopause status, tumor
size, diseases stage, histological grade, treatment
given, disease status, were obtained from the case files
maintained at the Medical Record Department of the
institute.
Immunohistochemistry (IHC)
Three to five micron thick sections were cut
from the formalin fixed paraffin embedded tissue
blocks of IDC patients using Leica microtome and
mounted on APES coated glass slides. The protein
e x p r e s s i o n o f G S T P 1 w a s s t u d i e d b y
immunohistochemistry technique using HRP/DAB
(ABC) detection IHC kit (Abcam). The instructions in
the kit insert were followed for carrying out the
procedure. Mouse monoclonal GSTP1 primary
antibody (Cat#sc-66000, Santa Cruz) was used at
1:100 dilution. Antigenicity was retrieved by heating
the sections in 10 mM sodium citrate buffer (pH, 6.0)
for 15-20 minutes in a pressure cooker. The specific
immune reaction was identified using 3,3′-
Diaminobenzidine (DAB) chromogen and the
sections were counterstained with haematoxylin.
Finally, the stained sections were mounted with DPX
and observed under a light microscope (Nikon,
Japan).
Scoring by Modified H- Score method
Scoring of the immunohistochemically
stained sections was done by independently by two
individual observers in a blinded manner. Semi
quantitative H-score method based on staining
positivity and staining intensity was used. The
staining intensity was graded on a four-point scale
from 0-3 (0- No staining, 1- weak staining intensity, 2-
moderate staining intensity and 3- strong staining
intensity). The percentage positivity of stained tumor
cells (0-100%) was counted by 10% intervals. Final
histoscore was calculated by multiplying the staining
intensity and the staining positivity resulting in a
range from 0 to 300.
Statistical Analysis
The data was analysed using Statistical
package for Social Sciences-SPSS software (SPSS
Inc. version 20). Two-tailed chi square test and
Spearman’s correlation was used to determine the
correlation between the GSTP1 protein expression
and various clinicopathological parameters of breast
cancer patients. P values ≤0.05 were considered to be
significant.
Results
The detailed clinicopathological
characteristics of total 70 histologically confirmed
breast cancer patients with invasive ductal carcinoma
are shown in Table 1.
|
Table 1: Patient and Tumor characteristics of Invasive
Ductal Breast Carcinoma patients
| Variables |
|
N |
Percentage
(%) |
Age
(Range: 33-85
years)
(Median age: 50
years) |
<50 |
38 |
54 |
>50 |
32 |
46 |
| Family History |
Absent |
60 |
86 |
Present |
10 |
14 |
| Site |
Left |
34 |
49 |
Right |
35 |
50 |
Bilateral |
1 |
1 |
| Menopausal
Status |
Pre-Menopausal |
18 |
26 |
Post-Menopausal |
52 |
74 |
| Histological
Type |
Invasive Ductal Carcinoma |
11 (39) |
17 (61) |
Invasive Lobular Carcinoma |
70 |
100 |
Paget’s Diseases |
0 |
0 |
| BR Score |
Score-3-5 |
9 |
13 |
Score-6-7 |
43 |
61 |
Score-8-9 |
18 |
26 |
Unknown |
0 |
0 |
Grade2 |
43 |
61 |
Grade3 |
18 |
26 |
Unknown |
0 |
0 |
| Tumor Size |
T1 |
13 |
18 |
T2 |
55 |
79 |
T3 |
2 |
3 |
T4 |
0 |
0 |
Lymph node
Involvement |
N0 |
28 |
40 |
N1 |
21 |
30 |
N3 |
14 |
20 |
N4 |
7 |
10 |
| Metastasis |
M0 |
70 |
100 |
M1 |
0 |
0 |
| Stage |
I |
7 |
10 |
II |
40 |
57 |
III |
23 |
33 |
IV |
0 |
0 |
| Stromal
Response |
Positive |
28 |
40 |
Negative |
42 |
60 |
| ER Status |
Positive |
42 |
60 |
Negative |
28 |
40 |
| PR Status |
Positive |
25 |
36 |
Negative |
45 |
64 |
| Her2 neu
Status |
Positive |
21 |
30 |
Negative |
49 |
70 |
| Molecular
Subtype |
LuminalA |
31 |
44 |
LuminalB |
11 |
16 |
Her2 amplification |
10 |
14 |
TNBC |
18 |
26 |
| Lymphatic
Permeation |
Positive |
30 |
43 |
Negative |
40 |
57 |
| Vascular
Permeation |
Positive |
11 |
16 |
Negative |
59 |
84 |
| Perineural
Invasion |
Positive |
7 |
10 |
Negative |
63 |
90 |
| Perinodal
Extension |
Positive |
20 |
29 |
Negative |
50 |
71 |
| Necrosis |
Positive |
16 |
23 |
Negative |
54 |
77 |
| Elastosis |
Positive |
4 |
6 |
Negative |
66 |
94 |
| Treatment |
Surgery |
4 |
6 |
S+CT |
16 |
22 |
S+RT |
2 |
3 |
S+HT |
4 |
6 |
S+CT+HT |
10 |
14 |
S+RT+HT |
2 |
3 |
S+CT+RT |
9 |
13 |
S+CT+RT+HT |
23 |
33 |
| Recurrence |
Presence |
1 |
1 |
Absence |
69 |
99 |
| Survival |
Died |
1 |
1 |
Alive |
69 |
99 |
|
| Incidence of GSTP1 protein expression in primary
tumors and adjacent normal tissue of patients with
breast cancer: |
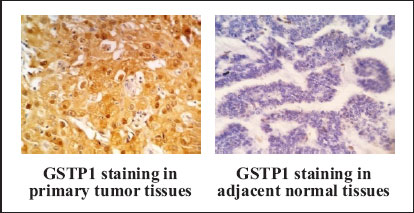
Immunostaining patternof GSTP1
expression in primary breast tumor cells was found to be heterogeneous and cytoplasmic and/or nuclear.
GSTP1 immunoreactivity was detected in 76%
(53/70) patients, while only 24% (17/70) of patient
were negative for GSTP1 expression. The staining
intensity was observed to be 28% (19/70) of +1, 24%
(17/70) of +2 and 24% (17/70) of +3. The median Hscore
for GSTP1 immunoreactivity was 40 (Range 0
to 300) and this was used as a cut-off value to
subgroup the patients into low (<40) and high (≥40)
expression groups. Accordingly, 51% (36/70) patients
displayed low (<40) and 49% (34/70) displayed high
(>40) GSTP1 protein expression. (Table 2)
In adjacent normal tissues the staining pattern
of GSTP1 expression was intensely nuclear or/and
cytoplasmic distributed throughout the epithelium.
No membranous staining of GSTP1 was seen. Further,
positive GSTP1 immunoreactivity in adjacent normal
tissue was observed in 97% (29/30), with staining
intensity of +1 in 27% (8/30), +2 in 30% (9/30) and +3
in 40% (12/30) in breast cancer patients (Table 2). The
median H-score for immunoreactivity in adjacent
normal adjacent tissue was 100 (Range 40 to 300).
This was used as a cut-off value to stratify the patients
into low (<100) and high (≥100) expression group.
Accordingly, 53% (16/30) patients displayed low
(<100) and 47% (14/30) displayed high (>100)
GSTP1 protein expression. (Table 2). Figure 1 shows
the representative photomicrographs of GSTP1
immunoreactivity in primary tumor tissue and
adjacent normal tissues.
|
Table 2: Incidence of GSTP1 immunoreactivity in
primary tumors and adjacent normal tissues
of breast cancer patients |
GSTP1 protein
expression |
Primary tumors
(N=70) |
Adjacent normal
tissues (N=30) |
| |
N |
% |
N |
% |
| Negative |
17 |
24 |
1 |
23 |
| Positive |
53 |
76 |
29 |
97 |
| +1 |
19 |
28 |
8 |
27 |
| +2 |
17 |
24 |
9 |
30 |
| +3 |
17 |
24 |
12 |
40 |
Median H-score
(Range) |
40 (0 to 300) |
100 (40 - 300) |
| <Median score |
36 |
51 |
16 |
53 |
| >Median score |
34 |
49 |
14 |
47 |
|
|
Figure 1: Representative photomicrographs of GSTP1 staining in
primary tumors and adjacent normal tissue of breast cancer |
| Correlation of GSTP1 protein expression in tumor
and adjacent normal tissues with clinical factors: |
A trend of decreased GSTP1 expression in
both, the tumor (χ2=2.890, r=-0.203, P=0.091) and
adjacent normal tissues (χ2=3.210, r=-0.320,
P=0.070) was observed with increase in age of breast
cancer patients. Similarly, a trend towards low GSTP1
protein expression was observed in primary tumor (χ2
=3.170, r=-0.210, P=0.070) and adjacent normal
tissues (χ2=3.51, r=-0.342, P=0.064) in patients with
post menopausal as compared to pre menopausal
breast cancer patients. On the other hand, no
significant difference was observed in the GSTP1
expression between the left and right sided breast
tumor or adjacent normal tissues. (Table 3) |
Table 3: Correlation of GSTP1 protein expression
in tumor and adjacent normal tissues with clinical
factors of patients with breast cancer |
|
Primary Tumor
(N=70) |
Adjacent normal
tissue (N=30) |
| |
GSTP1 Protein |
GSTP1 Protein |
| |
Lowexpression
N (%) |
Highexpression
N (%) |
Lowexpression
N (%) |
Highexpression
N (%) |
| Age (years) |
| ≤50 |
16(42) |
22(58) |
4(33) |
8(67) |
| >50 |
20(62) |
12 (38) |
12(67) |
6(33) |
| |
χ2=2.890, r=-0.203,
P=0.091 |
χ2=3.210, r=-0.320,
P=0.070 |
| Menopausal status |
| Pre |
6(33) |
12(67) |
2(25) |
6(75) |
| Post |
30(58) |
22(42) |
14(64) |
8(36) |
| |
χ2=3.170, r=-0.210,
P=0.070
|
χ2=3.510, r=-0.342,
P=0.064
|
| Site |
| Left |
17(50) |
17(50) |
9(56) |
7(44) |
| Right |
19(51) |
17(49) |
7(50) |
7(50) |
| |
χ2=0.972, r=-0.053,
P=0.734 |
χ2=0.110, r=+0.063,
P=0.743 |
|
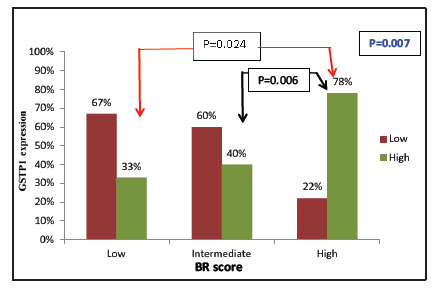
|
Figure 2: Correlation of GSTP1 expression in primary tumor with
BR score |
| Correlation of GSTP1 protein expression in tumor
and adjacent normal tissues with pathological
characteristics |
When correlated with the pathological
parameters, in primary tumors GSTP1 expression
showed a significant positive orrelation with
increasing BR score. Furthermore, it was observed
that GSTP1 expression was significantly higher in
patients with high BR score (78%) as compared to low
BR score (33%; χ2=5.082, r=+0.434, P=0.024) and
intermediate BR score (40%; χ2=7.425, =+0.349,
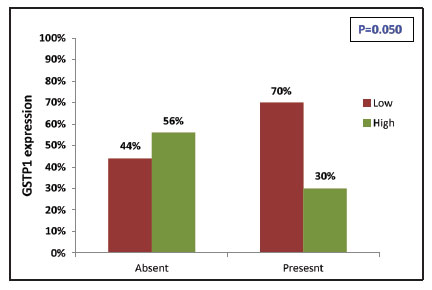
P=0.006). (Table 4; Figure 2). Moreover, its
expression significantly decreased in patients with
perinodal extension (χ2=3.866, r=-0.235, P=0.050)
indicating an inverse correlation of GSTP1 with
perinodal extension of tumor. (Table 4; Figure 3).
Apart from this, GSTP1 expression did not show any
significant correlation with any of the pathological
parameters in primary tumors or the adjacent normal
tissues. |
Table 4: Correlation of GSTP1 protein expression in
tumor and adjacent normal tissues with pathological
characteristics of patients with breast cancer |
|
Primary Tumor
(N=70) |
Adjacent normal
tissue (N=30) |
| |
GSTP1 Protein |
GSTP1 Protein |
| |
Low expression
N (%) |
High expression
N (%) |
Low expression
N (%) |
High expression
N (%) |
| Tumor Size |
| T1 |
6(46) |
7(54) |
3(60) |
2(40) |
| T2 |
30(56) |
24(44) |
12(52) |
11(48) |
| T3 |
0(0) |
3(100) |
1(50) |
1(50) |
| |
χ2=3.68, r=+0.054,
P=0.738 |
χ2=0.111, r=+0.057,
P=0.763 |
| Nodal Status |
| N0 |
14(50) |
14(50) |
6(37) |
10(63) |
| N1 |
8(40) |
12(60) |
4(68) |
2(32) |
| N2 |
10(67) |
5(33) |
4(80) |
1(20) |
| N3 |
4(57) |
3(43) |
2(67) |
1(33) |
| |
χ2=2.55, r=-0.090,
P=0.450
|
χ2=3.683, r=-0.300,
P=0.760
|
| Stage |
| I |
4(57) |
3(43) |
2(50) |
2(50) |
| II |
18(45) |
22(55) |
8(44) |
10(56) |
| III |
14(61) |
9(39) |
6(75) |
2(25) |
| |
χ2=1.574, r=-0.095,
P=0.436 |
χ2=2.098, r=-0.212,
P=0.261 |
| Early |
22(47) |
25(53) |
10(45) |
12(55) |
| Advanced |
14(61) |
9(39) |
6(75) |
2(25) |
| |
χ2=1.22, r=-0.130,
P=0.276 |
χ2=2.058, r=-0.262,
P=0.162 |
| BR Score |
| Low
(BR3-BR5) |
6(67) |
3(33) |
1(50) |
1(50) |
| Intermediate
(BR6 - BR7) |
26(60) |
17(40) |
10(59) |
7(41) |
| High
(BR8-BR9) |
4(22) |
14(78) |
5(45) |
6(55) |
| Overall |
χ2=8.38, r=+0.310,
P=0.007 |
χ2=0.480, r=+0.090,
P=0.595 |
| Low vs High |
χ2=5.082, r=+0.434, P=0.024 |
| Intermediate vs
High |
χ2=7.425, r=+0.349, P=0.006 |
| Lymphatic
Permeation |
|
| Absent |
20(50) |
20(50) |
9(50) |
9(50) |
| Present |
16(53) |
14(47) |
7(58) |
5(42) |
| |
χ2=0.076, r=-0.033,
P=0.786 |
χ2=0.201, r=-0.082,
P=0.667 |
| Vascular
Permeation |
|
|
| Absent |
31(53) |
28(47) |
14(50) |
14(50) |
| Present |
5(46) |
6(54) |
2(100) |
0(0) |
| |
χ2 =0.186, r=+0.052,
P=0.671 |
χ2=1.87, r=-0.250,
P=0.183 |
| Perineural
Invasion |
|
|
| Absent |
31(49) |
32(51) |
14(54) |
12(46) |
| Present |
5(71) |
2(29) |
2(50) |
2(50) |
| |
χ2=1.245, r=-0.133,
P=0.271 |
χ2=0.021, r=+0.026,
P=0.891 |
| Perinodal
Extension |
|
|
| Absent |
22(44) |
28(56) |
11(50) |
11(50) |
| Present |
14(70) |
6(30) |
5(63) |
3(37) |
| |
χ2=3.866, r=-0.235,
P=0.050 |
χ2=0.368, r=-0.111,
P=0.560 |
| Elastosis |
|
|
| Absent |
33(50) |
33(50) |
16(55) |
13(45) |
| Present |
3(75) |
1(25) |
0(0) |
1(100) |
| |
χ2=0.944, r=-0.116,
P=0.338 |
χ2=1.180, r=+0.199,
P=0.293 |
| Necrosis |
|
|
| Absent |
28(52) |
26(48) |
12(55) |
10(45) |
| Present |
8(50) |
8(50) |
4(50) |
4(50) |
| |
χ2=0.017, r=+0.016,
P=0.898 |
χ2=0.049, r=+0.040,
P=0.833 |
| Stromal
Response |
|
|
| Absent |
20(48) |
22(52) |
12(48) |
13(52) |
| Present |
16(57) |
12(43) |
4(80) |
1(20) |
| |
χ2=6.100, r=-0.093,
P=0.442 |
χ2=1.714, r=-0.239,
P=0.203 |
|
|
Figure 3: Correlation of GSTP1 expression in primary tumor with
perinodal extension |
Correlation of GSTP1 protein expression in tumor
and adjacent normal tissues with surface
receptors and molecular subtypes |
The ER–ve patients and TNBC positive
patients showed significantly higher GSTP1
expression in the primary tumors than ER+ve patients
(χ2=6.940, r=-0.315, P=0.008) (Figure 4) and TNBC negative patients (χ2=8.274, r=+0.344, P=0.004)
(Figure 5), respectively. According to molecular
subtypes, GSTP1 protein expression was significantly
higher in breast cancer patients with TNBC (78%),
followed by Her-2 (50%), Luminal A (39%) and
Luminal B (27%) (χ2=9.359, r=+0.292, P=0.014)
(Figure 6) (Table 5). |
Table 5: Correlation of GSTP1 protein expression in
tumor and adjacent normal tissues with surface
receptors and molecular subtypes in patients with
breast cancer |
|
Primary Tumor
(N=70) |
Adjacent normal
tissue (N=30) |
| |
GSTP1 Protein |
GSTP1 Protein |
| |
Low expression
N (%) |
High expression
N (%) |
Low expression
N (%) |
High expression
N (%) |
| ER |
|
|
|
|
| Negative |
9(32) |
19(68) |
7(54) |
6(46) |
| Positive |
27(64) |
15(36) |
9(53) |
8(47) |
| |
χ2=6.940, r=-0.315 ,
P=0.008 |
χ2=0.002, r=+0.009 ,
P=0.962 |
| PR |
|
|
|
|
| Negative |
21(47) |
24(53) |
12(60) |
8(40) |
| Positive |
15(60) |
10(40) |
4(40) |
6(60) |
| |
χ2=1.144, r=-0.128 ,
P=0.292
|
χ2=1.071, r=+0.189,
P=0.317
|
| Her2 |
|
|
|
|
| Negative |
23(47) |
26(53) |
13(57) |
10(43) |
| Positive |
13(62) |
8(38) |
3(43) |
4(57) |
| |
χ2=1.31, r=-0.137,
P=0.257 |
χ2=0.403, r=+0.116,
P=0.542 |
| TNBC |
|
|
|
|
| Negative |
32(62) |
20(38)) |
10(53) |
9(47) |
| Positive |
4(22) |
14(78) |
6(55) |
5(45) |
| |
χ2=8.274, r=+0.344 ,
P=0.004 |
χ2=0.018, r=-0.018,
P=0.923 |
Molecular
subtype |
|
| Luminal A |
19(61) |
12(39) |
7(58) |
5(42) |
| Luminal B |
8(73) |
3(27) |
2(40) |
3(60) |
| Her2 |
5(50) |
5(50) |
1(50) |
1(50) |
| TNBC |
4(22) |
14(78) |
6(55) |
5(45) |
| |
χ2=9.359, r=+0.292,
P=0.014 |
χ2=0.493, r=-0.033,
P=0.863 |
|
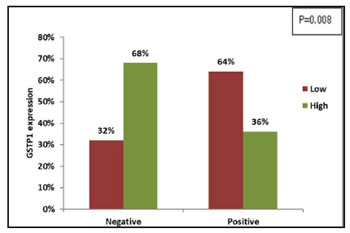 |
Figure 4: Correlation of tumoral GSTP1 expression with ER
status |
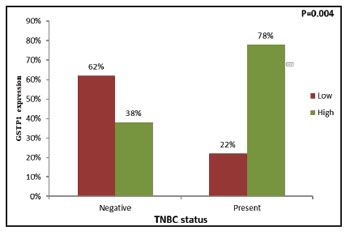 |
Figure 5: Correlation of tumoral GSTP1 expression with TNBC
status |
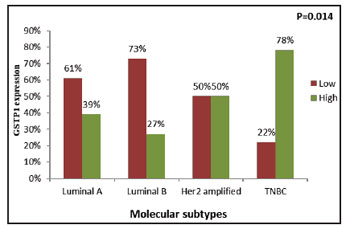 |
Figure 6: Correlation of tumoral GSTP1 expression with
molecular subtype |
| |
|
| Comparison of GSTP1 protein expression
according to ERPR status in breast cancer patients |
As depicted in Table 6, patients when sub
grouped according to surface receptor i.e. ERPR status, in the primary tumors the incidence of GSTP1
expression was significantly higher in patients with
ERPR–ve tumors as compared to patients having
ERPR+ve tumors (χ2= 4.137, r=-0.277, P=0.043)
(Figure 7). Patients with TNBC molecular subtype
had significantly high tumoral GSTP1 protein
expression as compared to patients with luminal A
(χ2=6.979, r=+0.377, P=0.008) (Figure 8) and
luminal B (χ2=7.180, r=+0.498, P=0.006) (Figure 9)
molecular subtype, respectively. |
Table 6: Comparison of GSTP1 protein expression
with ERPR status, Luminal A versus TNBC,
Luminal B versus TNBC and Luminal A versus
Luminal B in patients with breast cancer |
|
Primary Tumor |
Adjacent normal
tissue |
| |
GSTP1 Protein |
GSTP1 Protein |
| |
Low expression
N (%) |
High expression
N (%) |
Low expression
N (%) |
High expression
N (%) |
Estrogen receptor and Progesterone receptor status |
| |
(N=53) |
(N=23) |
| ERPR-ve |
9(32) |
19(68) |
7(54) |
6(46) |
| ERPR+ve |
15(60) |
10(40) |
4(40) |
6(60) |
| |
χ2=4.137, r=-0.277,
P=0.043 |
χ2=0.434, r=+0.137,
P=0.532 |
Luminal A versus TNBC |
| |
(N=49) |
(N=23) |
| Luminal A |
19(61) |
12(39) |
7(58) |
5(42) |
| TNBC |
4(22) |
14(78) |
6(55) |
5(45) |
| |
χ2= 6.979, r=+0.377,
P=0.008
|
χ2=0.034 , r=+0.038 ,
P=0.863
|
Luminal B versus TNBC |
| |
(N=29) |
(N=16) |
| Luminal B |
8(73) |
3(27) |
2(40) |
3(60) |
| TNBC |
4(22) |
14(78) |
6(55) |
5(45) |
| |
χ2=7.180, r=+0.498,
P=0.006 |
χ2=0.291, r=-0.135,
P=0.169 |
Luminal A versus Luminal B |
| |
(N=42) |
(N=17) |
| Luminal A |
19(61) |
12(39) |
7(58) |
5(42) |
| Luminal B |
8(73) |
3(27) |
2(40) |
3(60) |
| |
χ2=0.463, r=-0.105,
P=0.508 |
χ2=0.476, r=+0.167,
P=0.521 |
|
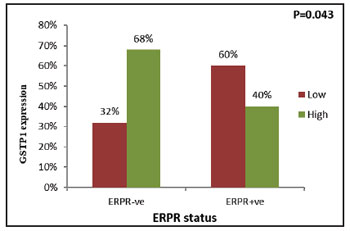 |
Figure 7: Correlation of tumoral GSTP1 expression with ERPR
status |
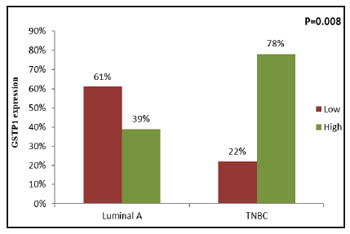 |
Figure 8: Correlation of tumoral GSTP1 expression between
Luminal A and TNBC subtypes |
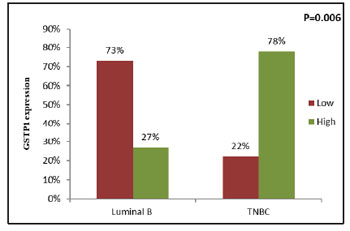 |
Figure 9: Correlation of tumoral GSTP1 expression between
Luminal B and TNBC subtypes |
| |
|
| Discussion |
Breast cancer is the most common malignant
tumor in women worldwide accounting for
approximately one third of all female cancers. It is
clinically a heterogeneous disease with multifactorial
etiology. Factors influencing prognosis and
t r e a t m e n t o u t c o m e a r e s o l e l y b a s e d o n
clinicopathological factors and molecular surface
based markers such as tumor size, grade, histological
type, lymph node involvement, ER, PR, Her2 and
TNBC status. Although these parameters guide
therapeutic decision making, a great variability in
disease outcome and ultimately prognosis have been
observed amongst individual patients and within same
stage. Due to variability in clinical progression of
disease, identification of markers, that could predict
tumor behavior is necessary. Identification of novel biomarkers and an understanding of their clinical
significance would benefit both current therapies and
prognosis.7
GSTP1s are multifunctional enzymes that
play a critical role in cellular detoxification by
catalyzing the conjugation of many hydrophobic and
electrophilic compounds with reduced glutathione
and may influence mutagenesis and carcinogenesis. It
is known to protect normal cells from the influence of
carcinogenic materials. Goto et al (2009) found
GSTP1 is present in mitochondria and cytosol and
nucleus in mammalian cell line and these enzymes
play an important role in maintaining physiological
function in these structures.20 In the present study, in
histological confirmed adjacent normal tissues, the
staining pattern of GSTP1 expression was intensely
nuclear and/ or cytoplasmic and distributed
throughout the epithelium. Ninety-seven percent of
the tissues had positive GSTP1 immuno-reactivity.
Similar to the present study, Vecanova et al (2011) in
breast cancer also observed cytoplasmic and/or
nuclear GSTP1 positive expression in 100% normal tissues. The presence of GSTP1 in normal tissue
indicates a probable protective function of the
enzyme.21
Although present study observed GSTP1
expression in histologically confirmed adjacent
normal tissues, studies have shown loss of GSTP1
expression in approximately 2/3rd of the carcinoma in
situ cases.22 Ramos-Gomez et al (2001) observed that
breast epithelial cells with lack of expression of
GSTP1 suffer from DNA damage more easily upon
exposure to carcinogens.23 Thus, GSTP1 probably acts
to protect cells from cancer initiation. The present
study observed reduced tumoral GSTP1 protein
expression (76%) when compared to GSTP1
expression in histologically confirmed adjacent
normal tissues (97%). Similarly, Haas et al (2006),
also observed GSTP1 expression was consistently
weaker in invasive carcinomas than in non-neoplastic
mammary glands.24 Thus, probably indicating that
with the decrease of GSTP1 protein there might be a
loss of protective function during the transition from
normal to malignant transformation. However, no
consensus has been achieved yet regarding the
association between GSTP1 expression and
malignant transformation.
In addition, the present study observed
cytoplasmic and/or nuclear immuno expression in
primary tumors (76%). Similar to the present study,
Vecanova et al (2011) observed that cytoplasmic
and/or nuclear GSTP1 positive expression in 63% of
invasive carcinoma showed positive GSTP1
immunoreactivity.21 Moreover, several reports are
available in invasive breast cancer, showing
cytoplasmic or nuclear GSTP1 immunoreactivity in
nearly 77%-50% of patients.7, 25-27 Beside breast cancer,
in accordance to present study, positive GST π nuclei
or cytoplasmic immunoreactivity was observed in
71.4% of cases in advanced CRC,28 nasopharyngeal
cancer,29 NSCLC,30,31 and in patients with advanced
gastric cancer.32 Contradictory to above, Ali-Osman et
al (1997) observed in patients with gliomas, 38%
high, 33% moderate and 29% low staining intensity
with cytoplasmic and/or nuclear GST-π expression in
tumor cells.33
Further in the present study, when
relationship of GSTP1 and clinical parameters such as
age, menopausal status, tumor site was evaluated, no
significant association was noted, however a
decreasing trend of GSTP1 protein expression was
observed in elderly patient group and in post
menopausal patients when compared to respective
counterparts. Muftin et al (2015) observed
significantly higher GSTP1 positivity in elderly age
group patients but the authors had not correlated with
menopausal status.27 Huang et al (2003),26 Haas et al
(2006)24 and Chen et al (2017)7 failed to find any
significant difference of GSTP1 according to patients age. Miyake et al (2012)34 and Chen et al (2017)7 could
not find any significant difference of GSTP1 protein
expression and menopausal status. To best of our
knowledge, there exist very rare reports on association
of GSTP1 protein expression and age, menopausal
status, site in patients with invasive breast cancer.
When relationship between GSTP1 and
pathological variables were evaluated, it was
observed that high tumoral GSTP1 protein expression
was associated with breast cancer patients having N0
and N1 nodal status, T1 and T2 tumor size and in early
disease stage when compared to their respective
counterparts. Although, the difference was found to be
statistically non significant but it confers a probable
role of GSTP1 as an early event in breast
carcinogenesis. Likewise, Buser et al (1997) showed
that lower GSTs levels are associated with more
advanced breast cancer.35 Haas et al (2006) linked
smaller tumor sizes with high GSTP1 expression.24
Recently, Chen et al (2017) reported significantly
higher GSTP in smaller tumors (P=0.023), early
clinical stage of the tumor, but no significant
association with the remaining clinicopathological
characteristics, axillary lymph node status (P=0.071),
pathological type (P=0.607), histological grade
(P=0.750).7 Contrary to the present study, Muftin et al
(2015) found high GSTP1 expression was
significantly associated with stage III and large tumor
size (>2cm), (p< 0.05).27 On the other hand, higher
GSTP1 protein expression was significantly
associated with aggressive prognostic factor such as
high BR (8-9) score and presence of perinodal
invasion. In accordance to the present results, Jardim
et al (2012)36 and Li et al (2014),37 associated the
highest GSTP1 expression with high histological
levels of invasive ductal carcinomas. Nevertheless,
other authors have demonstrated contrary results.
Cairns et al (1992) associated an absence of GSTP1 in
tumor tissue with the highest histological grade.38
According to Miyake et al (2012), GSTP1 positivity
significantly varied according to histological grade
(HG) that is, HG2 tumors showed a lower positivity
(32/81, 39.5%) than HG1 tumors (9/19, 47.4%) and
HG3 tumors (16/22, 72.7%).34 Muftin et al (2015)
found high GSTP1 expression was significantly
associated with grade III histology,27 whereas Haas et
al (2006) linked GSTP1 with well differentiated
tumors.24 Additionally, Huang et al observed GST-pi
immunoreactivity was not significantly correlated
with any of the traditional histological factors known
to influence prognosis.23 The plausible reason for this
difference between our results and those conflicting
results may be due to the diversity of GSTP1
assessment methods and the difference in sample size.
Since, GSTs isoenzyme facilitate clearance of
endogenous hydrophobic compounds such as
hormones, steroids, etc. GSTP1 binds non-covalently to steroids and hormones, allowing it to act as an
intracellular buffer to minimize short-term changes in
steroid levels. The breast being an important organ of
the body which is continuously exposed to these
steroids and it is therefore estrogens act as
endogenous tumor initiators in the breast tissue when
GSTP1 is inactivated by promoter methylation.
Therefore, expression of GSTP1 protein and surface
receptor was evaluated, higher GSTP1 protein
expression was observed in tumors with ER-ve
patients (68%), PR-ve (53%) and TNBC patients
(78%) as compared to their respective counter parts.
Similar high GSTP1 protein expression was noted in
patients with ERPR–ve tumors. Consistent with
present study, Miyake et al (2012),34 Peters et al
(1993)39 and Gilbert L et al (1993)40 found that GSTP1
expression was significantly associated with ER
negativity and PR negativity in patients with breast
cancer. On the other hand, Huang et al (2003),23 and
Haas et al (2006)24 failed to observe any significant
correlation between GSTP1 and ER, PR status.
Additionally, when sub grouped according to
molecular subtypes, GSTP1 protein expression was
significantly higher in breast cancer patients with
TNBC (78%), followed by Her-2 (50%), luminal A
(39%) and luminal B (27%) (χ2 =9.359, r = 0.292,
P=0.014). A recent study by Pakdeethai et al (2012),
speculated a significant correlation of estrogen
receptor negativity with high GSTP1 expression (p
0.001).25 The other parameters - tumor size, tumor
grade, lymph node status, HER2- IHC score, Ki67
index did not correlate with high or low GSTP1
protein expression. It is evident that TNBC subtypes
are considered more aggressive than the luminal A or
B subtypes, or even those overexpressing HER-2/neu.
Louie et al (2016) found that GSTP1 was a new TNBC
oncogene that governed the pathogenicity of cancer
by regulating glycolysis, and energy and fat
metabolism.15 They believed that GSTP1, a new
TNBC target, was a risk factor for breast cancer and
promoted breast cancer. Chen et al (2017), found
approximately 77% positive rate of GSTP1 protein
expression in TNBC patients.7 Interestingly, the
current study demonstrated significant high
expression of tumoral GSTP1 protein expression in
TNBC as compared to the other molecular subtypes
(luminal A, luminal B and Her-2), indicating a useful
target for TNBC patients.
|
| Conclusion |
Our preliminary data shows higher
c y t o p l a s m i c a n d / o r n u c l e a r s t a i n i n g
immunopositivity pattern of GSTP1 was observed in
adjacent normal tissues as compared to tumor tissues,
which was indicative of loss of GSTP1 protective
function during the transition of malignant
transformation. Observation of higher GSTP1 with traditionally aggressive prognostic factors such as
High BR score, presence of perinodal extension, ER
PR negativity & TNBC, probably indicates that
GSTP1 might be useful to identify patients with
aggressive phenotype. In TNBC patients it may be a
useful target. However, it needs to be confirmed by
covering a larger number of patients. |
| References |
1. Farmohammadi A, Arab-Yarmohammadi V,
Ramzanpour R: Association analysis of rs1695
and rs1138272 variations in GSTP1 gene and
breast cancer susceptibility. Asian Pac J Cancer
Prev 2020;21:1167-1172
2. Miller JW, King JB, Joseph DA, Richardson LC:
Centers for Disease Control and Prevention
(CDC). Breast cancer screening among adult
women-behavioral risk factor surveillance
system, United States, 2010. MMWR Morb
Mortal Wkly Rep 2012;61:46-50
3. Siegel R, DeSantis C, Virgo K et al: Cancer
treatment and survivorship statistics, 2012. CA: A
Cancer Journal for Clinicians 2012;62:220-241
4. Flores-Ramos LG, Escoto-De Dios A, Puebla-
Pérez AM et al: Association of the tumor necrosis
factor-alpha-308G> A polymorphism with breast cancer in Mexican women. Genet Mol Res
2013;12:5680-5693
5. Gallegos-Arreola MP, Figuera-Villanueva LE,
Ramos-Silva A et al: The association between the
844ins68 polymorphism in the CBS gene and
breast cancer. Archives of Medical Science: AMS
2014;10:1214-1224
6. Kinsella MD, Nassar A, Siddiqui MT, Cohen C:
Estrogen receptor (ER), progesterone receptor
(PR), and HER2 expression pre - and postneoadjuvant
chemotherapy in primary breast
carcinoma: a single institutional experience.
International Journal of Clinical and
Experimental Pathology 2012;5:530-536
7. Chen G, Zhang H, Sun L et al: Prognostic
significance of GSTP1 in patients with triple
negative breast cancer. Oncotarget 2017;8:68675-
68680
8. Hayes JD, Pulford DJ: The glut athione Stransferase
supergene family: regulation of GST
and the contribution of the lsoenzymes to cancer
chemoprotection and drug resistance part I.
Critical Reviews in Biochemistry and Molecular
Biology 1995;30:445-520
9. Hayes JD, Flanagan JU, Jowsey IR: Glutathione
transferases. Annu. Rev. Pharmacol. Toxicol
2005;45:51-88
10. Atkinson HJ, Babbitt PC: Glutathione
transferases are structural and functional outliers
in the thioredox in fold . Biochem is
try
2009;48:11108-11116
11. UdomsinprasertR , PongjaroenkitS,
Wongsantichon J et al: Identification,
characterization and structure of a new Delta class
glutathione transferase isoenzyme. Biochemical
Journal 2005;388:763-771
12. Strange RC, Fryer AA: The glutathione Stransferases:
influence of polymorphism on
cancer susceptibility. IARC scientific
publications 1999:231-249
13. Vijayakumar H, Thamilarasan SK, Shanmugam A
et al: Glutathione transferases superfamily: coldinducible
expression of distinct GST genes in
Brassica oleracea. International Journal of
Molecular Sciences 2016;17:1211
14. Board PG, Baker RT, Chelvanayagam G, Jermiin
LS: Zeta, a novel class of glutathione transferases
in a range of species from plants to humans.
Biochemical Journal 1997; 328:929-935
15. Louie SM, Grossman EA, Crawford LA et al:
GSTP1 Is a Driver of Triple-Negative Breast
Cancer Cell Metabolism and Pathogenicity. Cell
Chemical Biology 2016;23:567-578
16. Bai YL, Zhou B, Jing XY et al: Predictive role of
GSTs on the prognosis of breast cancer patients
with neoadjuvant chemotherapy. APJCP
2012;13:5019-5022
17. Franco RL, Schenka NG, Schenka AA, Rezende
LF, Gurgel MS: Glutathione S-transferase Pi
expression in invasive breast cancer and its
relation with the clinical outcome. Journal of
BUON : Official Journal of the Balkan Union of
Oncology 2012;17:259-264
18. Duggan C, Ballard-Barbash R, Baumgartner RN
et al: Associations between null mutations in
GSTT1 and GSTM1, the GSTP1 Ile 105 Val
polymorphism, and mortality in breast cancer
survivors. Springerplus 2013;2:1-9
19. Oliveira AL, Oliveira Rodrigues FF, Dos Santos
RE, Rozenowicz RL, Barbosa de Melo M:
GSTT1, GSTM1, and GSTP1 polymorphisms as
a prognostic factor in women with breast cancer
GMR 2014;13:2521-2530
20. Goto S, Kawakatsu M, Izumi SI et al: Glutathione
S-transferase π localizes in mitochondria and
protects against oxidative stress. Free Radical
Biology and Medicine 2009;46:1392-1403
21. Vecanova J, Hodorova I, Mihalik J et al:
Immunohistochemical evaluation of Pi class
glutathione S-transferase expression in invasive
breast carcinoma. Bratislavske Lekarske Listy
2011;112:67-70
22. Bellamy CO, Harrison DJ: Evaluation of
glutathione S-transferase Pi in non-invasive
ductal carcinoma of breast. British Journal of
Cancer 1994;69:183-185
23. Ramos-Gomez M, Kwak MK, Dolan PM et al:
Sensitivity to carcinogenesis is increased and chemoprotective efficacy of enzyme inducers is
lost in nrf2 transcription factor-deficient mice.
Proceedings of the National Academy of Sciences
2001;98:3410-3415
24. Haas S, Pierl C, Harth V et al: Expression of
xenobiotic and steroid hormone metabolizing
enzymes in human breast carcinomas.
International Journal of Cancer 2006;119:1785-
1791
25. Pakdeethai S, Fongchaiya V, Pongtheerat T,
Iampenkhae K, Sampatanukul P: Relationship
between promoter methylation and protein
expression of glutathione S - transferase gene
class P1 in breast cancer. Asian Archives of
Pathology 2012;8:45-53
26. Huang J, Tan PH, Thiyagarajan J, Bay BH:
Prognostic significance of glutathione Stransferase-
pi in invasive breast cancer. Modern
Pathology 2003;16:558-565
27. Muftin NQ, AL-Rubaiꞌe SH, Yaseen NY, Aziz RS:
Expression of glutathione S-transferase P1 in
women with invasive ductal carcinoma.
International Journal of Current Microbiology
and Applied Sciences 2015;4:455-465
28. Kim M, Suh H, Cho EJ, Buratowski S:
Phosphorylation of the yeast Rpb1 C-terminal
domain at serines 2, 5, and 7. Journal of Biological
Chemistry 2009;284:26421-26426
29. Jayasurya A, Yap WM, Tan NG, Tan BK, Bay BH:
Glutathione S-transferase π expression in
n a s o p h a r y n g e a l c a n c e r. A r c h i v e s o f
Otolaryngology-Head & Neck Surgery
2002;128:1396-1399
30. Bai F, Nakanishi Y, Kawasaki M, Takayama K et
al: Immunohistochemical expression of
glutathione S- transferase- π can predict
chemotherapy response in patients with nonsmall
cell lung carcinoma. Cancer: Interdisciplinary
International Journal of the American Cancer
Society 1996;78:416-421
31. Zhu WY, Hunag YY, Liu XG et al: Prognostic
evaluation of CapG, gelsolin, P-gp, GSTP1, and
Topo-II proteins in non-small cell lung cancer. The
Anatomical Record: Advances in Integrative
A n a t o m y a n d E v o l u t i o n a r y B i o l o g y
2012;295:208-214
32. Kwon HC, Roh MS, Oh SY et al: Prognostic value
of expression of ERCC1, thymidylate synthase,
and glutathione S-transferase P1 for 5-
fluorouracil/oxaliplatin chemotherapy in
advanced gastric cancer. Annals of Oncology
2007;18:504-509
33. Ali-Osman F, Brunner JM, Kutluk TM, Hess K:
Prognostic significance of glutathione Stransferase
pi expression and subcellular
localization in human gliomas. Clinical Cancer
Research 1997;3:2253-2261
34. Miyake T, Nakayama T, Naoi Y et al: GSTP 1
expression predicts poor pathological complete
response to neoadjuvant chemotherapy in
ER-negative breast cancer. Cancer Science
2012;103:913-920
35. Buser K, Joncourt F, Altermatt HJ et al: Breast
cancer: pretreatment drug resistance parameters
(GSH-system, ATase, P-glycoprotein) in tumor
tissue and their correlation with clinical and
prognostic characteristics. Annals of Oncology
1997;8:335-341
36. Jardim BV, Moschetta MG, Gelaleti GB et al:
Glutathione transferase pi (GSTpi) expression in
breast cancer: an immunohistochemical and
m o l e c u l a r s t u d y. A c t a H i s t o c h e m i c a
2012;114:510-517
37. Li W, Song M: Expression of multidrug resistance
proteins in invasive ductal carcinoma of the
breast. Oncology Letters 2014;8:2103-2109
38. C a i r n s J , Wr i g h t C , C a t t a n A R e t a l :
Immunohistochemical demonstration of
glutathione S-transferases in primary human
breast carcinomas. The Journal of Pathology
1992;166:19-25
39. Peters WH, Roelofs HM, Van Putten WL et al:
Response to adjuvant chemotherapy in primary
breast cancer: no correlation with expression of
glutathione S-transferases. British Journal of
Cancer 1993;68:86-92
40. Gilbert L, Elwood LJ, Merino M et al: A pilot
study of pi-class glutathione S-transferase
expression in breast cancer: correlation with
estrogen receptor expression and prognosis in
node-negative breast cancer. Journal of Clinical
Oncology 1993;11:49-58 |
|
 |
|
 |
OPD Information |
 |
NABH Certified |
 |
Ethics Committee Accredited for NABH |
 |
ISO 15189:2012 |
|